
Dust transport from the Sahara to the Mediterranean

The extensive dust plume is clearly visible in several satellite observations. This also caused a drop in air quality at several locations in the Mediterranean region. Ground-based lidar observations from Italy show several layers of dust from south to north of the peninsula, mostly impacting atmospheric layers between 2 and 5 km, with intrusions into the boundary layer starting from 20 June, thus impacting local air quality.
Strong winds in North West Sahara lifted a substantial quantity of dust that has been transported across the western part of the Mediterranean. An animation of the MSG dust air mass product shows how the dust plume (coloured pink) over North Algeria starts to spread towards the Mediterranean on 19 June 2023.
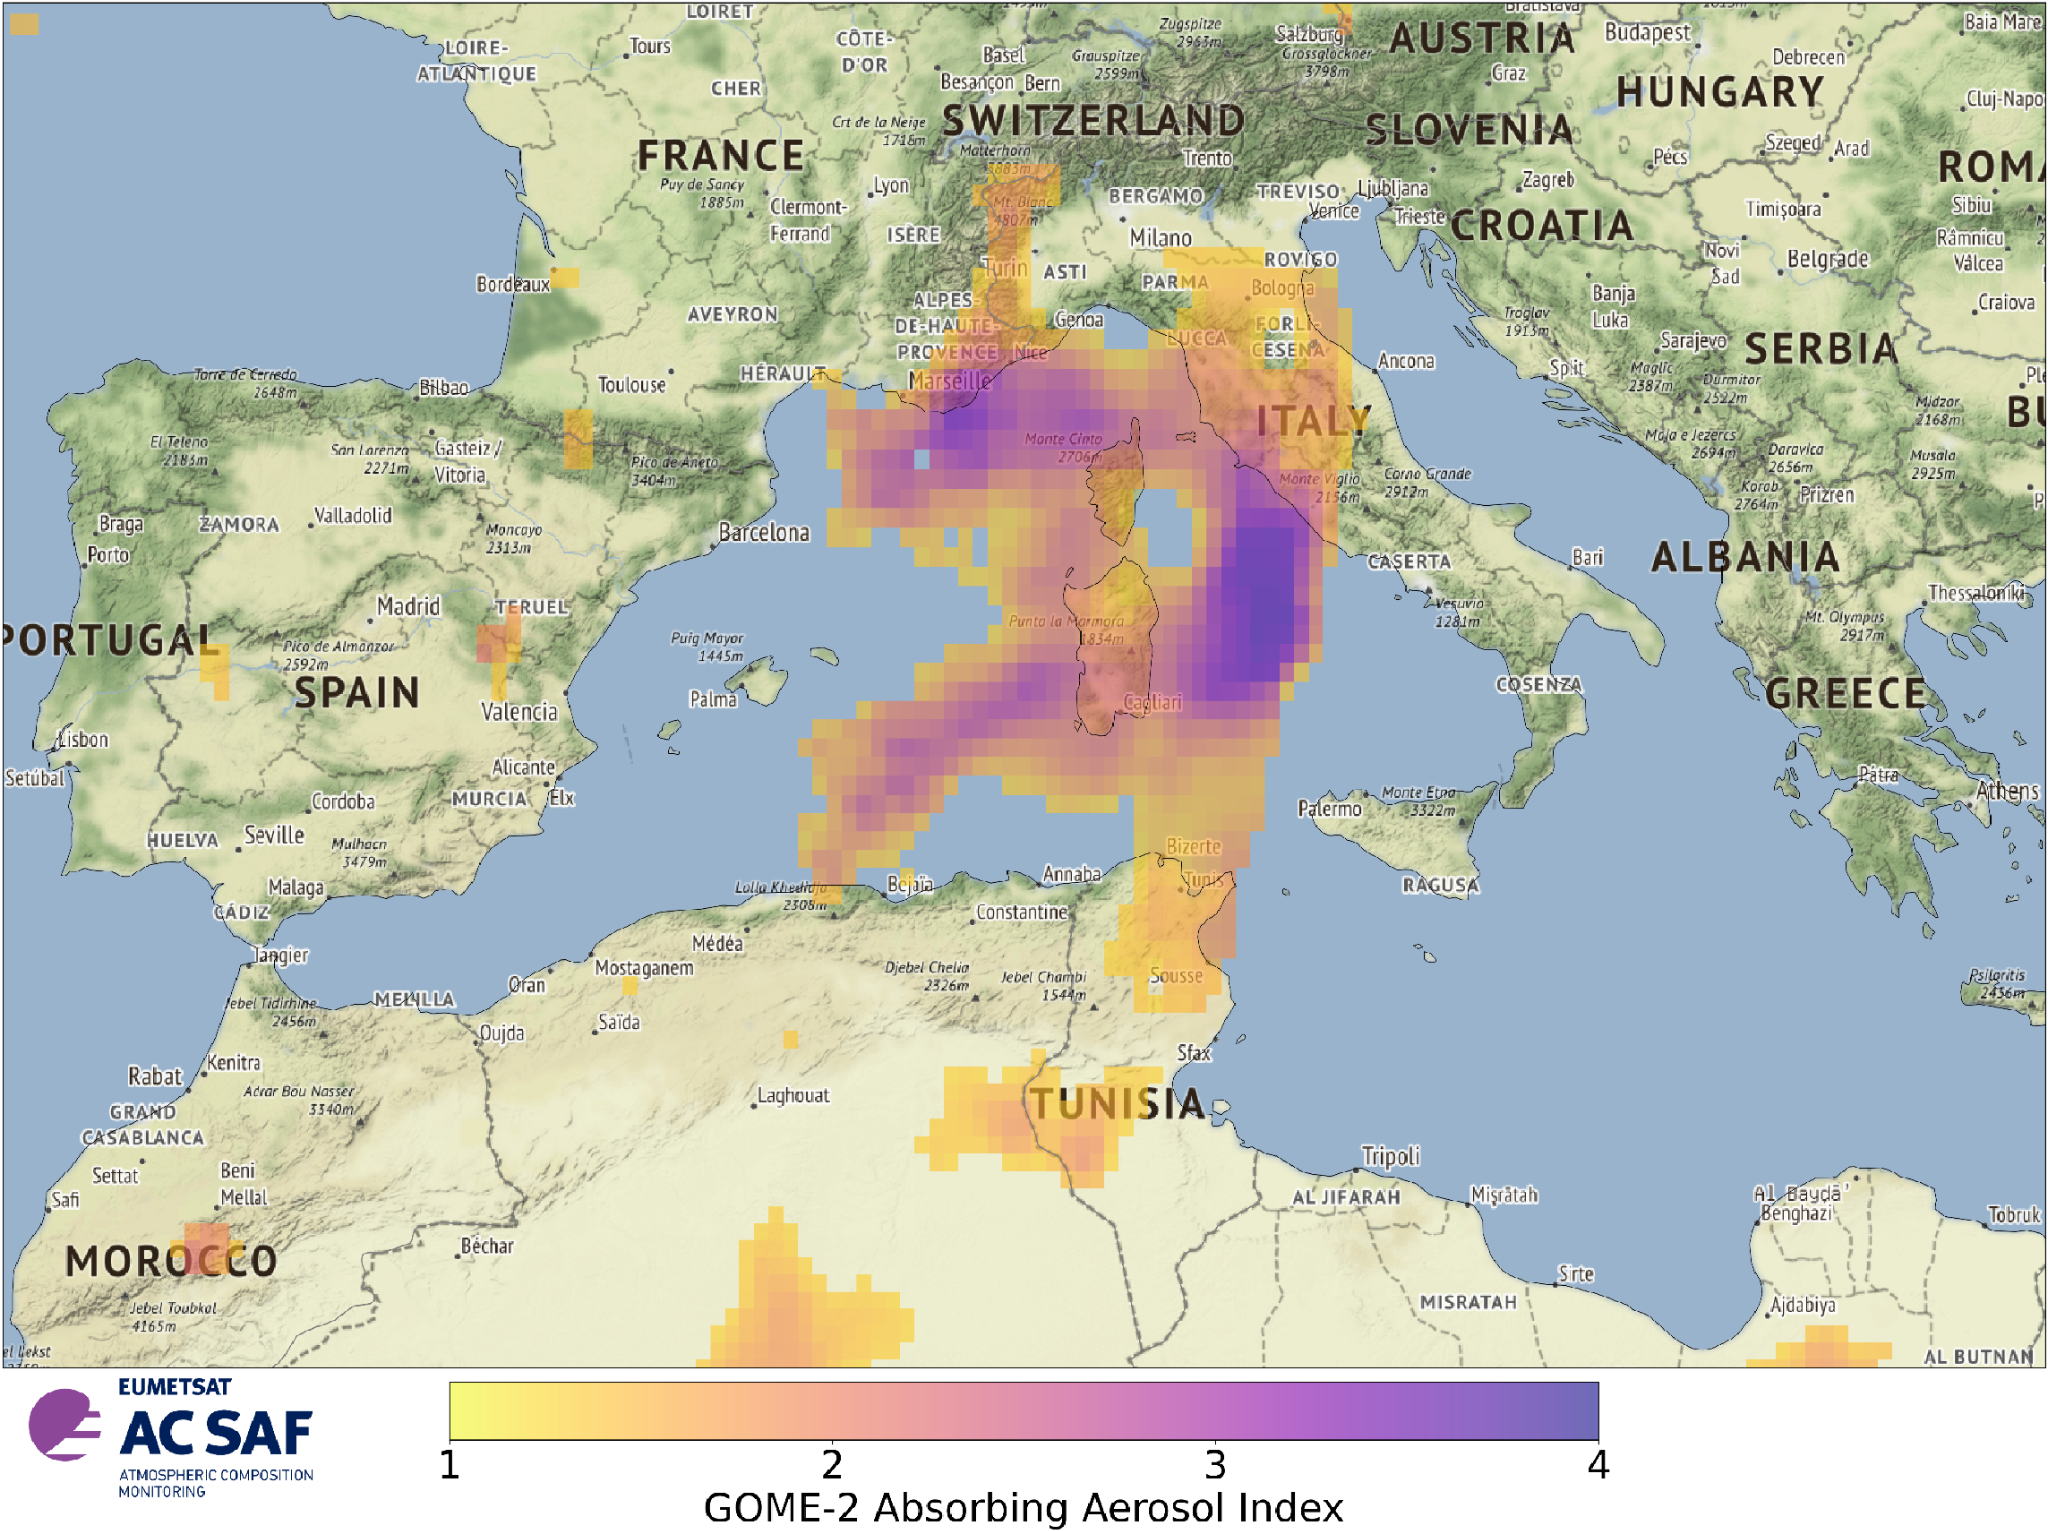
Absorbing Aerosol Index (AAI) from GOME-2 instruments onboard Metop-B and -C satellites shows the spread of the plume before noon on 20 June (Figure 1).
In the early morning (04:45 UTC) scan of the MSG satellite on 21 June, the dust plume is clearly visible over Italy (Figure 2). At this time of the day when the sun is low in the sky, the features of dust plumes are enhanced in RGB images from a geostationary satellite.
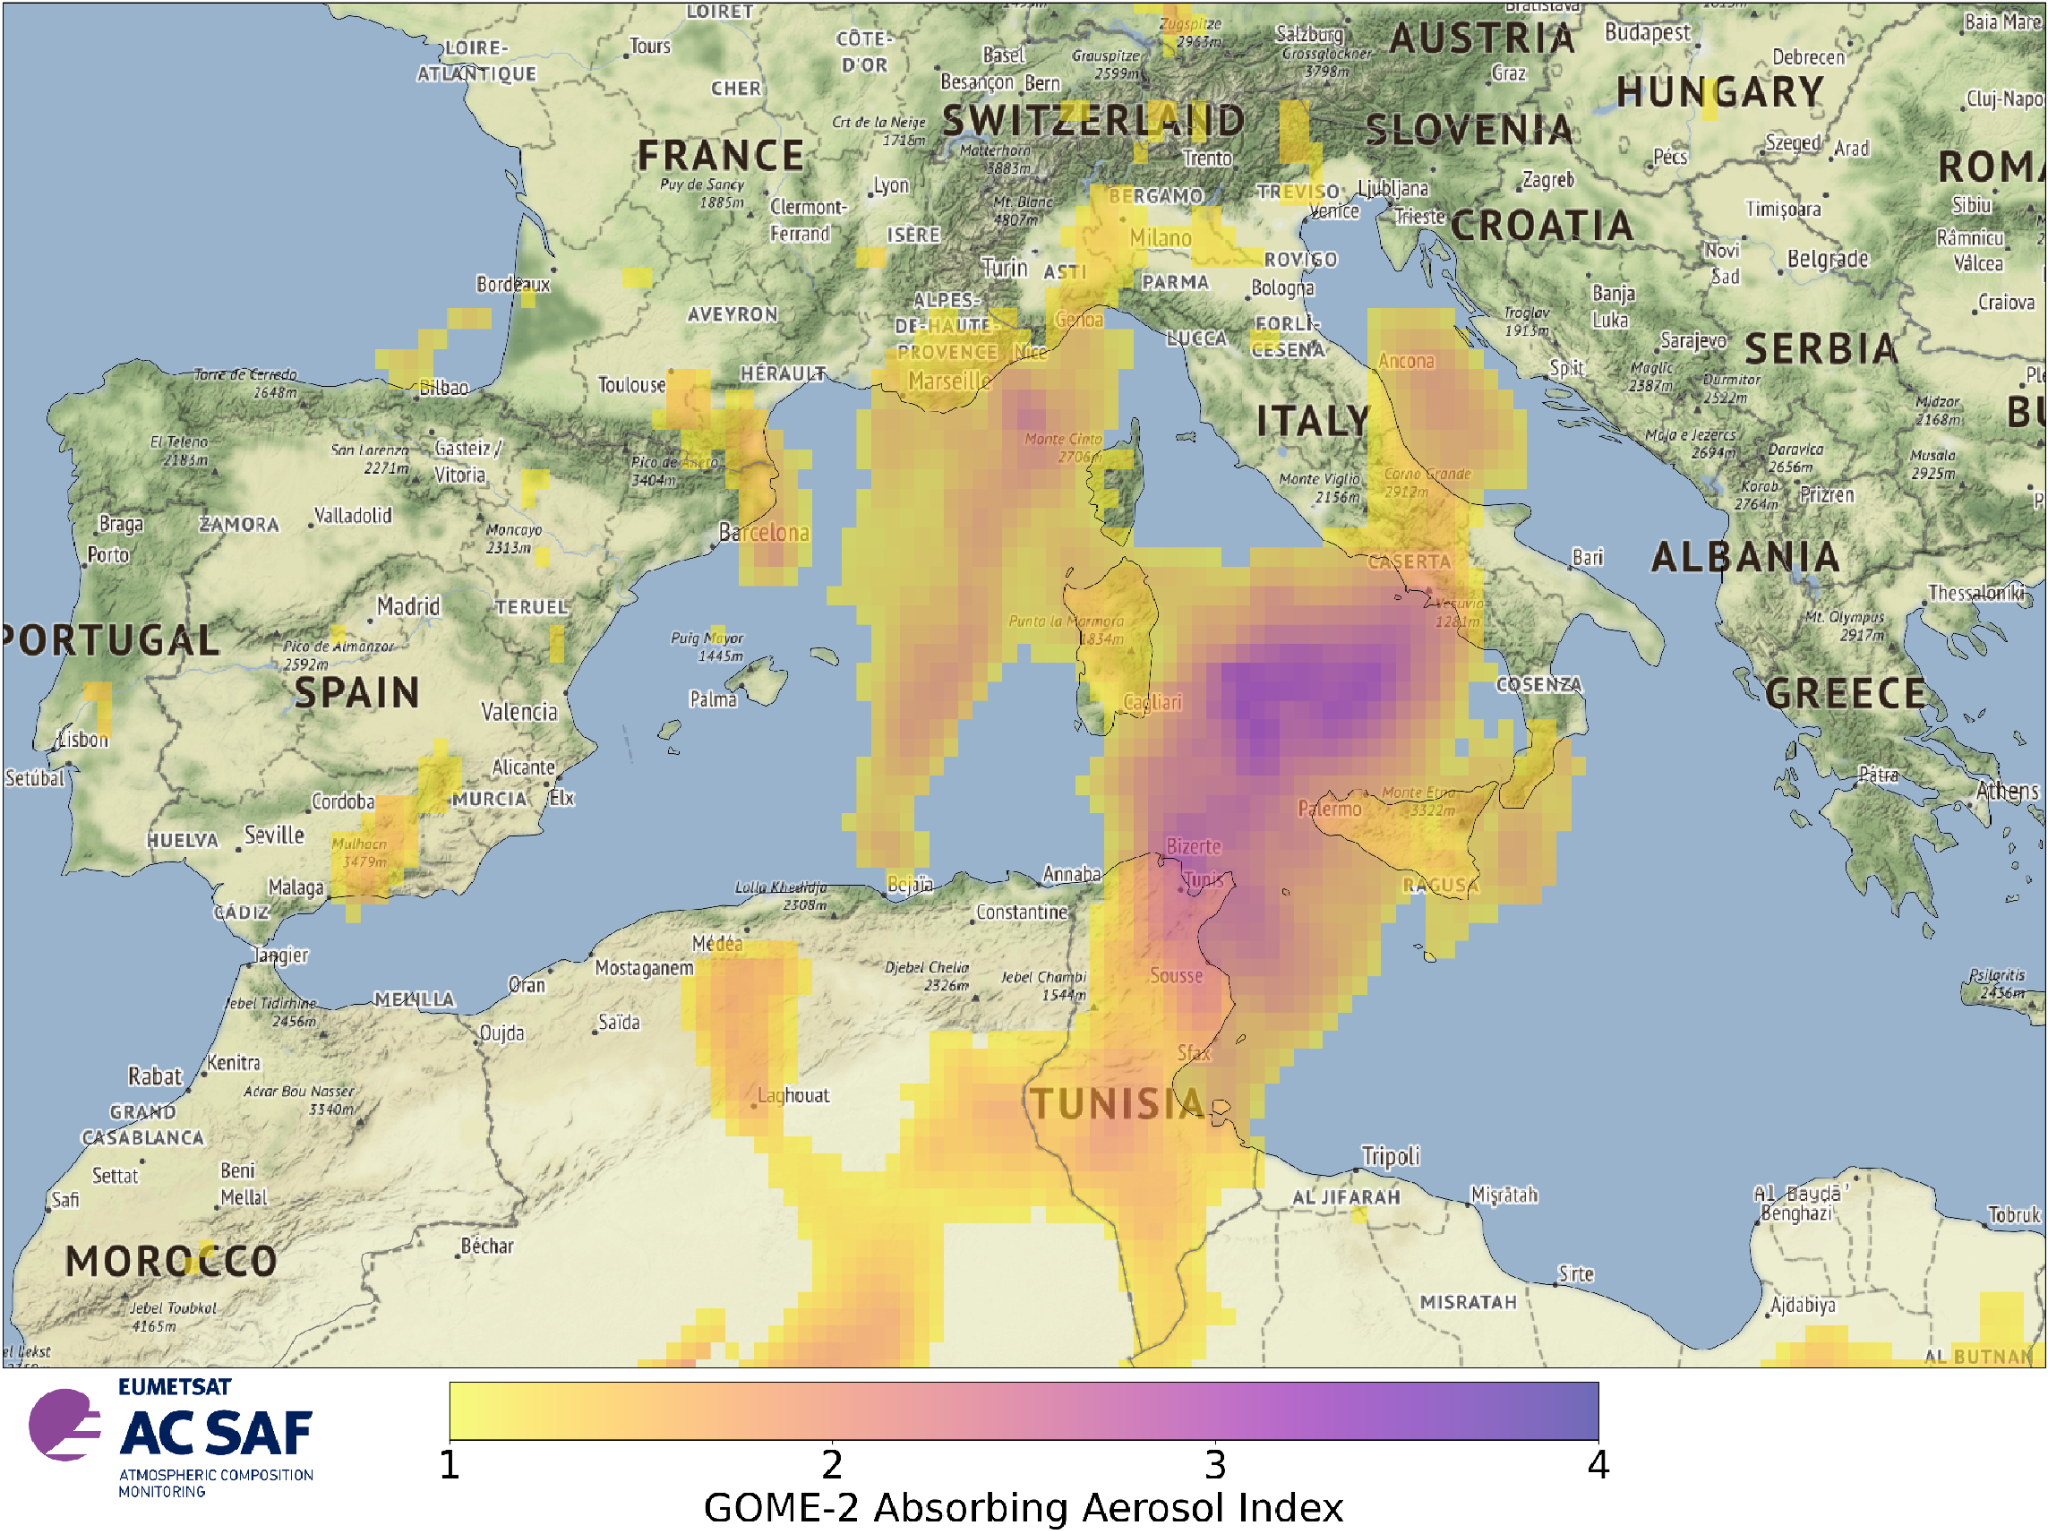
The dust transport has also affected air quality in the Mediterranean (Figure 3). On 21 June, several ground-based stations in the Balearic Islands and the south coast of France measured moderate to poor air quality index (Figure 4) due to increased PM10 concentrations (particles smaller than 10 micrometers in diameter) caused by the dust. The extent of the plume on 21 June before noon is shown by GOME-2 AAI observations (Figure 5).


The synergy between space and ground-based observations is essential to characterize properly the dust event evolution, relating the plume height with the geographical distribution.
Observations from the ground can make use of active remote sensing (such as lidars / ceilometers) to identify the temporal evolution of the aerosol profile over a certain site.

Alicenet is a growing consortium established and coordinated by CNR-ISAC and involving different partner institutions in Italy. It also contributes to the European E-PROFILE program run by EUMETNET. The network extends from North to Southern Italy, thus covering a wide range of atmospheric and environmental conditions within the Mediterranean area.
Desert dust plumes across Italy (Figure 6) have been detected through active remote sensing instruments operationally (24/7) monitoring aerosol vertical profiles and clouds within the Italian Alicenet network. Figure 6 shows examples of Alicenet aerosol vertical profiles recorded between 19 and 21 June. It clearly shows the high (yellow color) aerosol load (expressed in terms of backscatter) associated with the arrival of the desert dust plume between 2 and 5 km altitude, with the higher values observed in the Italian southernmost sites in Sicily. The dust plume is shown to firstly impact south-west Italy (19 June) and to extend to northern sites on 20 June, with a complex layering. ALC profiles also show the plume to descend to the lowermost atmospheric levels on 21 June, thus impacting local PM air quality. In those Alicenet sites having the aerosol depolarization information, the increase in depolarization (bottom panels, red color) associated with the non-spherical nature of dust particles is clearly detectable.

Source: EUMETSAT